Hello.
How can we help you?


Quick Start: View Responses & Reports
Published
August 27, 2024
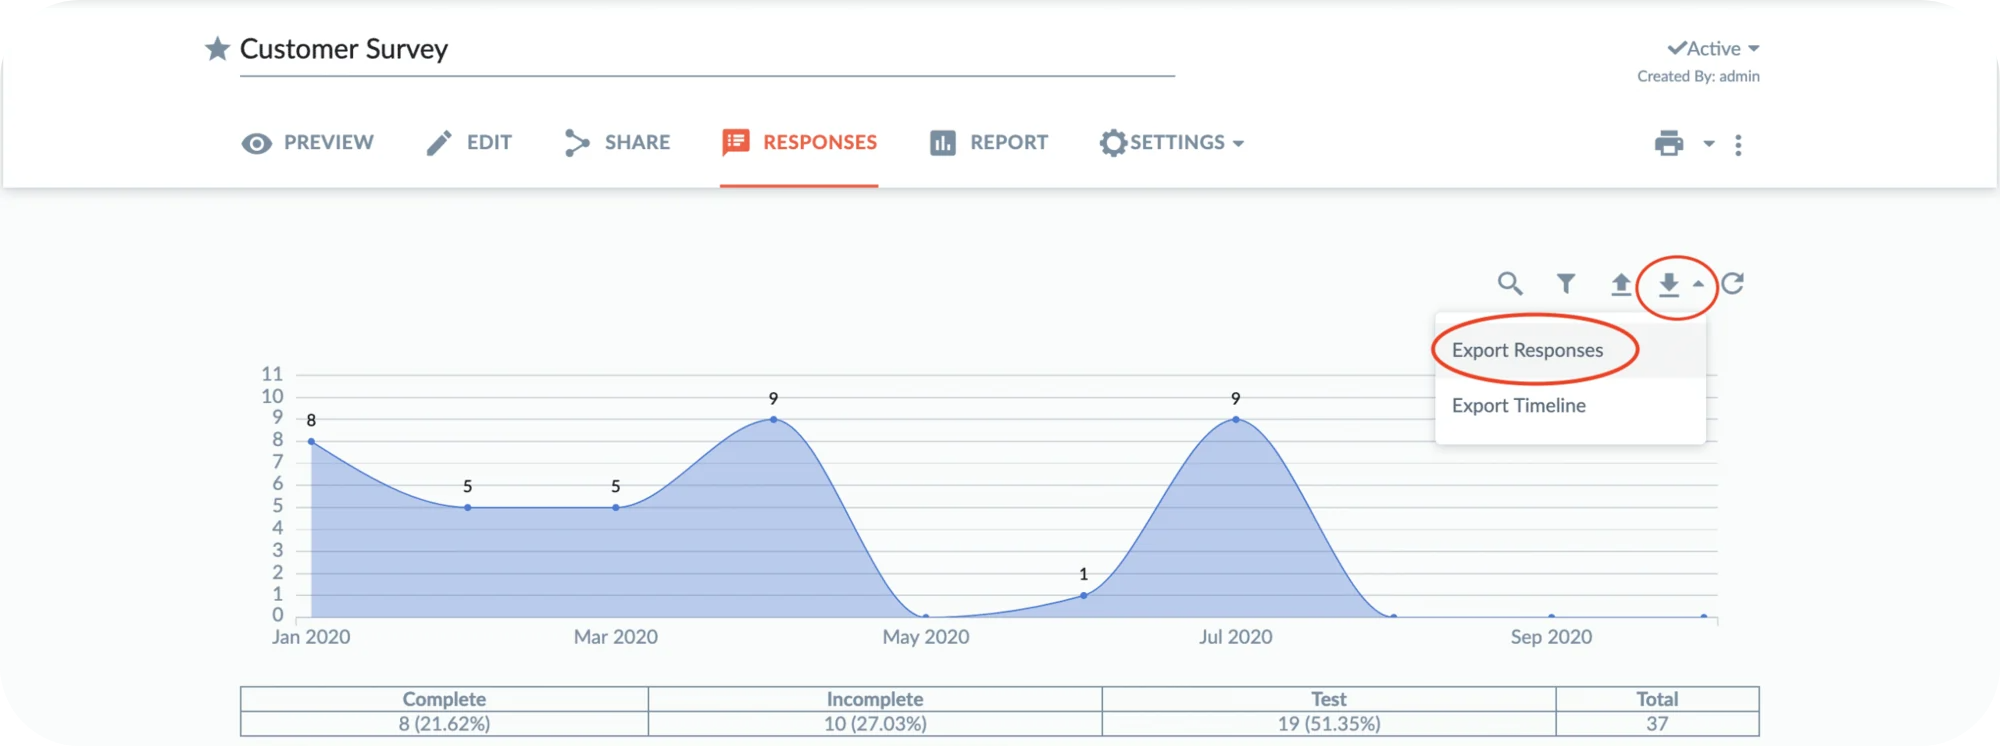
1. View or Export Responses (your raw survey data)
- Go to the Responses tab of your survey to view and edit individual responses. Use the filter icon to filter out test/incomplete responses or add a date filter.
- Click the Export icon to export your response data.
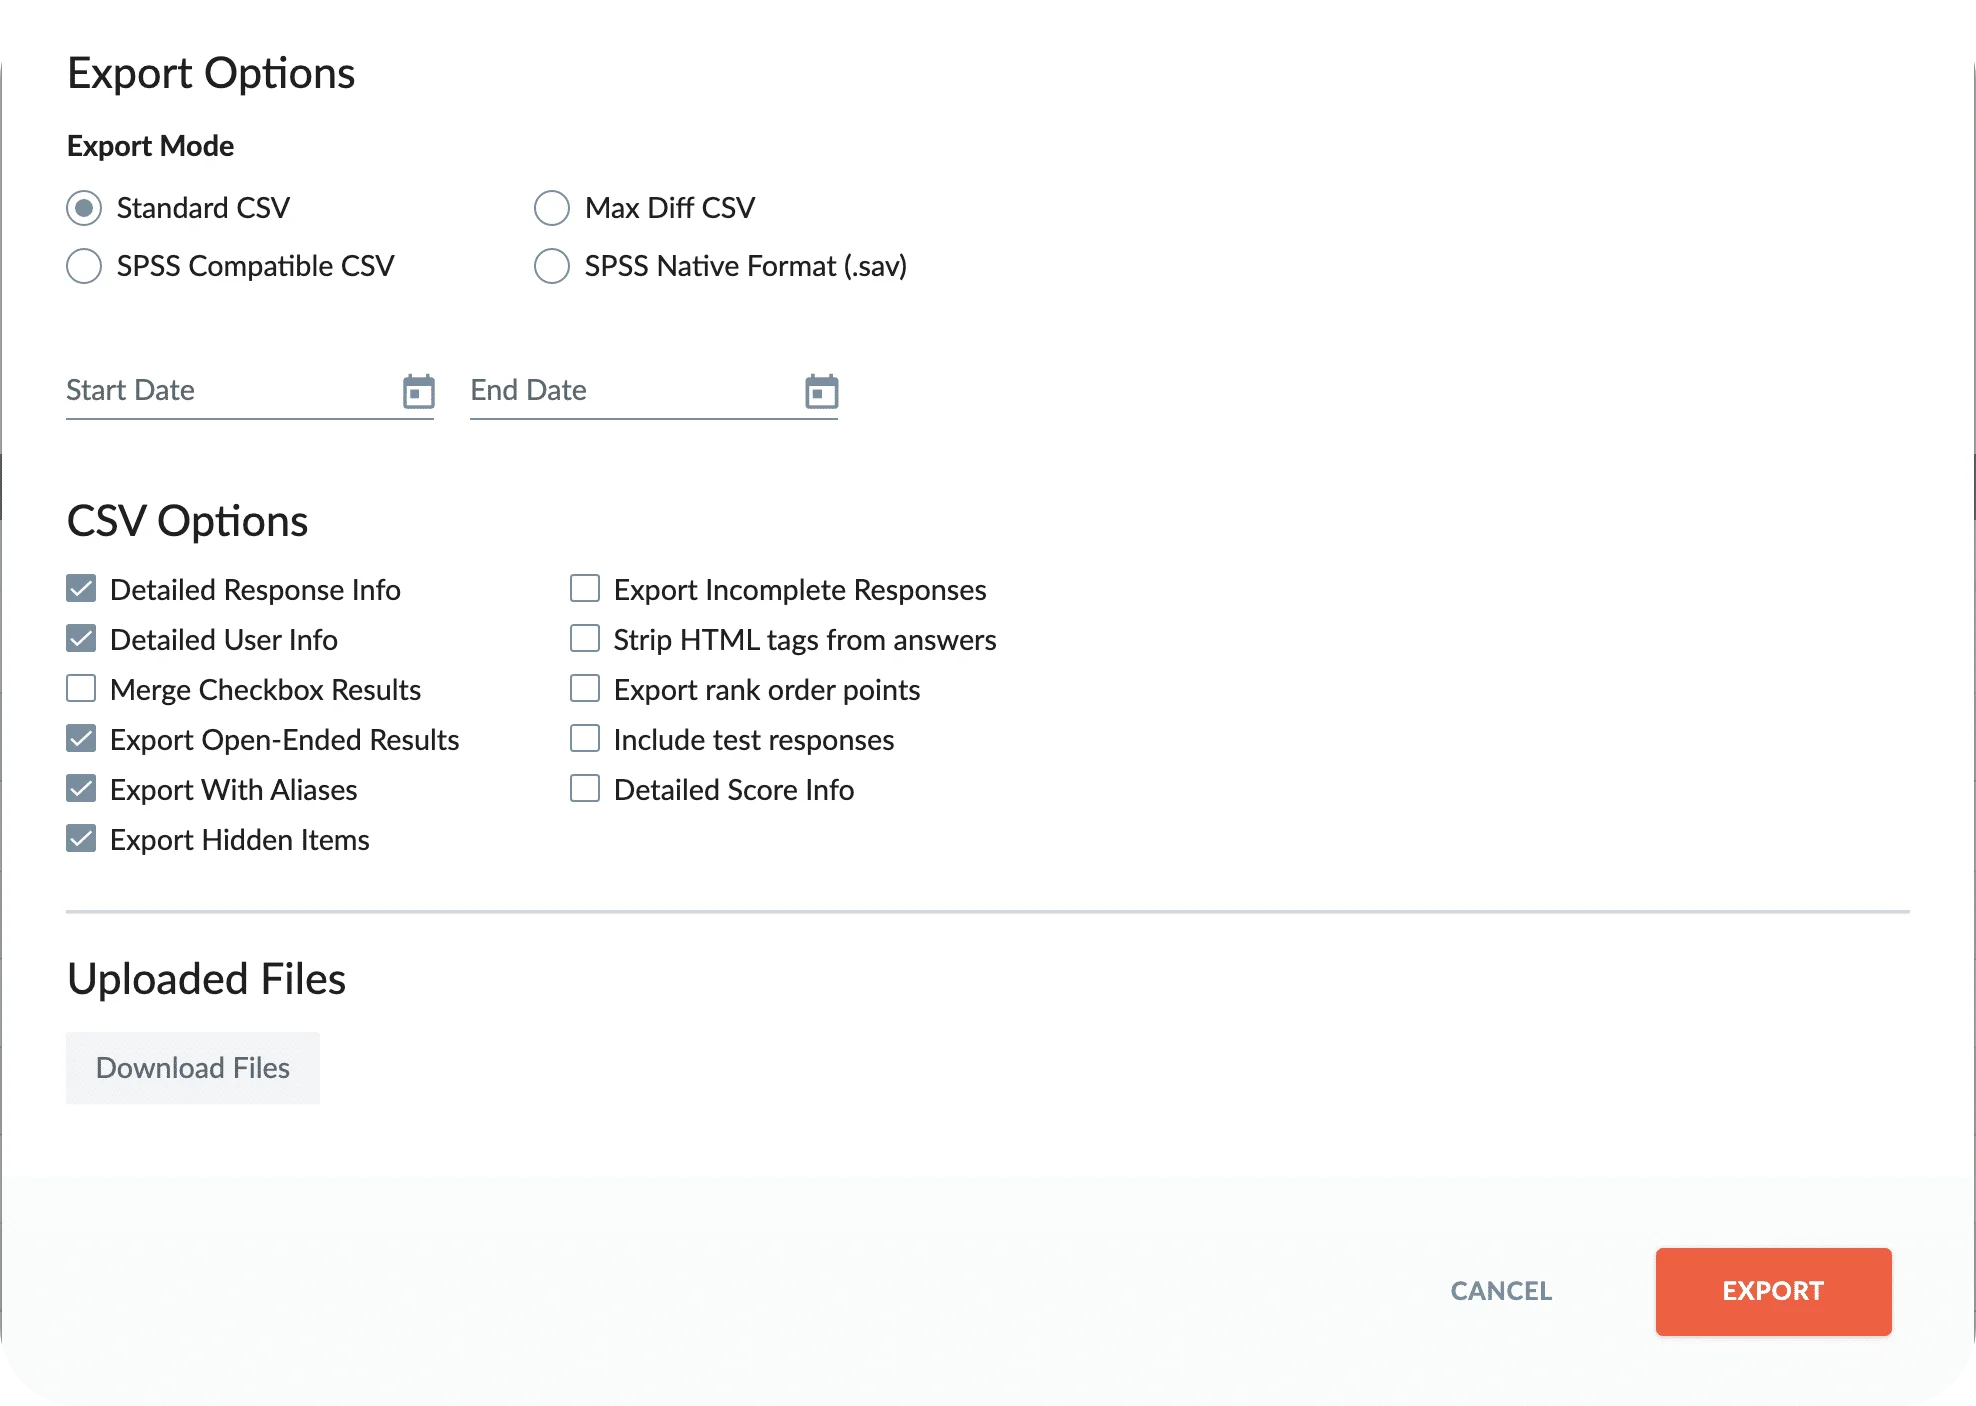
- The Export Responses option will allow you to choose to export to .csv or .sav, and choose what information to export.
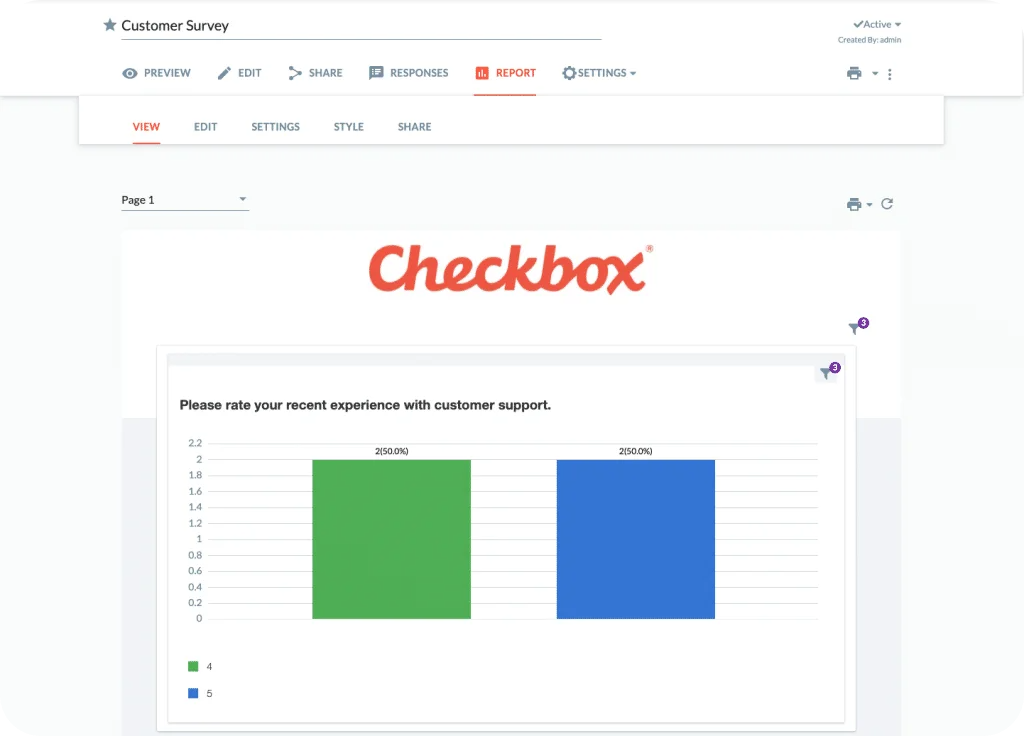
2. View your Standard Report
- From within your survey editor, click the Report tab to view your auto-generated Standard Report. This report is created automatically based on default settings in your account (a System Admin on your account can change the defaults under Account Settings -> Reports.)
- Click the Edit tab to add additional charts, change chart types, hide charts, or add filters. Note that auto-generated charts cannot be deleted, only hidden from view using the “eye” icon.
- You can add branding to your report by choosing a style template on the Style tab.
- To share your report, click the printer icon for printing and exporting options or click the Share tab to share a report link for live results.
- For more details, see our Reports Overview.
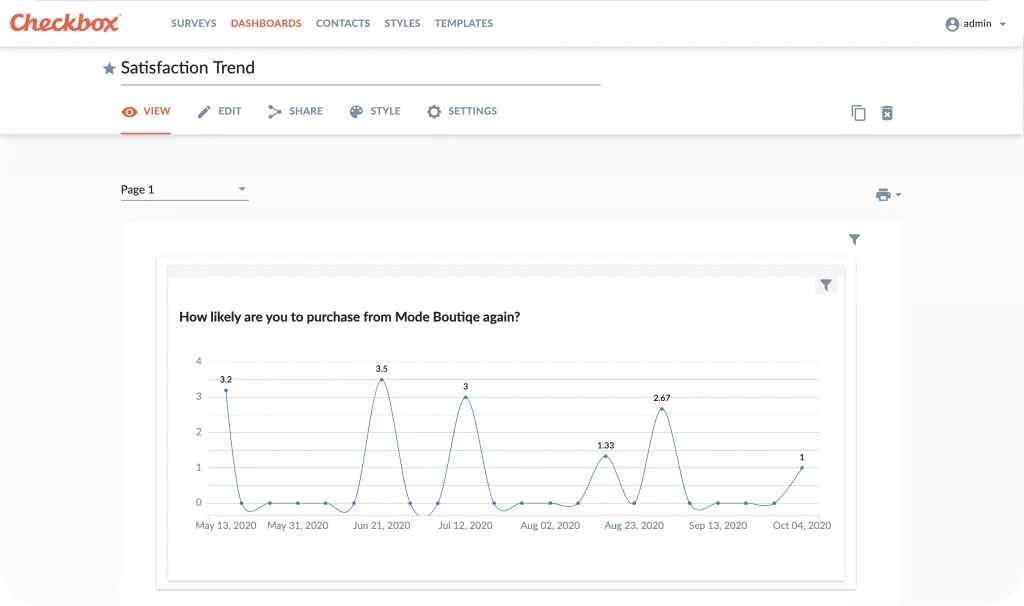
3. Create & Run Custom Dashboards
- To create a more custom report or a report based on multiple surveys, you will want to use the Dashboards feature.
- Go to the main Dashboards menu to create a new custom report.
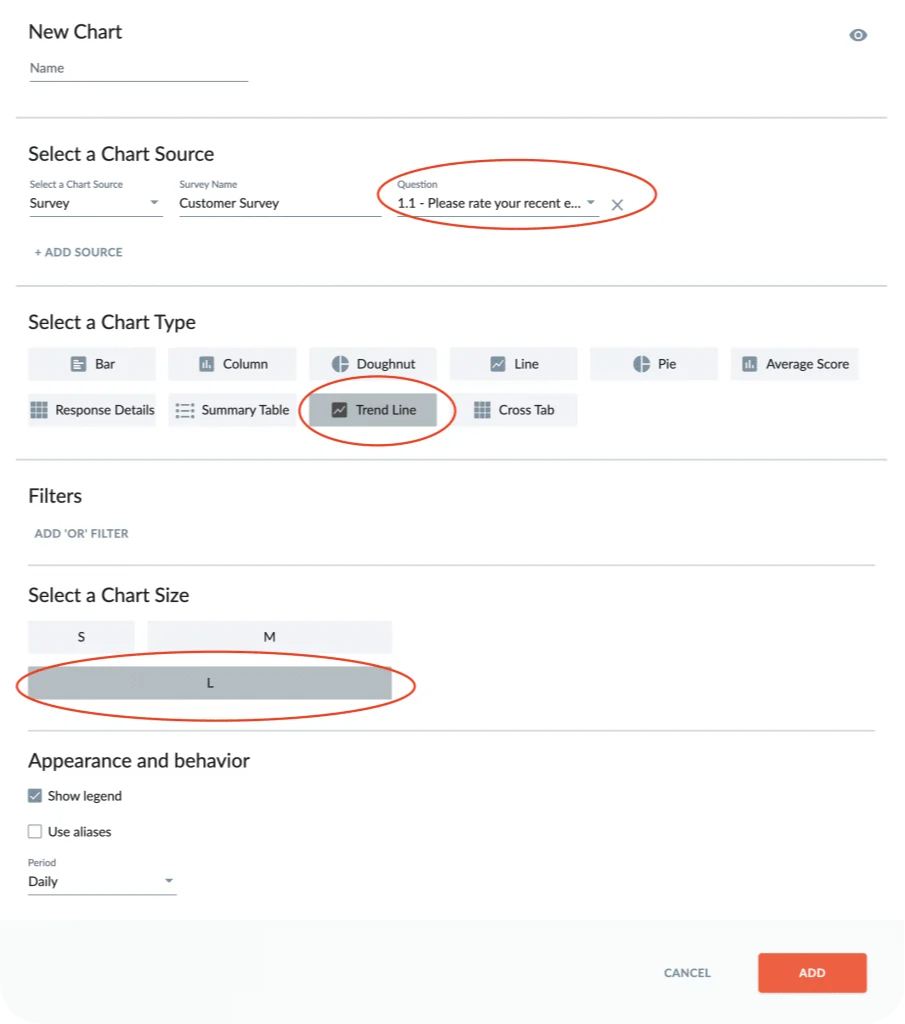
- Click Create Dashboard
- Click Add Dashboard Chart
- Choose your dashboard item options 1) Name (optional), 2) Survey and Question Source, 3) Chart Type, 4) Report Filter (optional), and 5) Size
- Click Add
- Once you are done adding your charts, click the View tab to view your results
- For more details, see our Dashboards Guide
Related articles
No items found.